

Data that changes your decisions.
Your data is clean, and yet the decisions don't change. We turn data into three concrete levers: what the exec team looks at, what the site tests, and where the media budget goes.
Unified reporting across 60+ countries and 130 stores
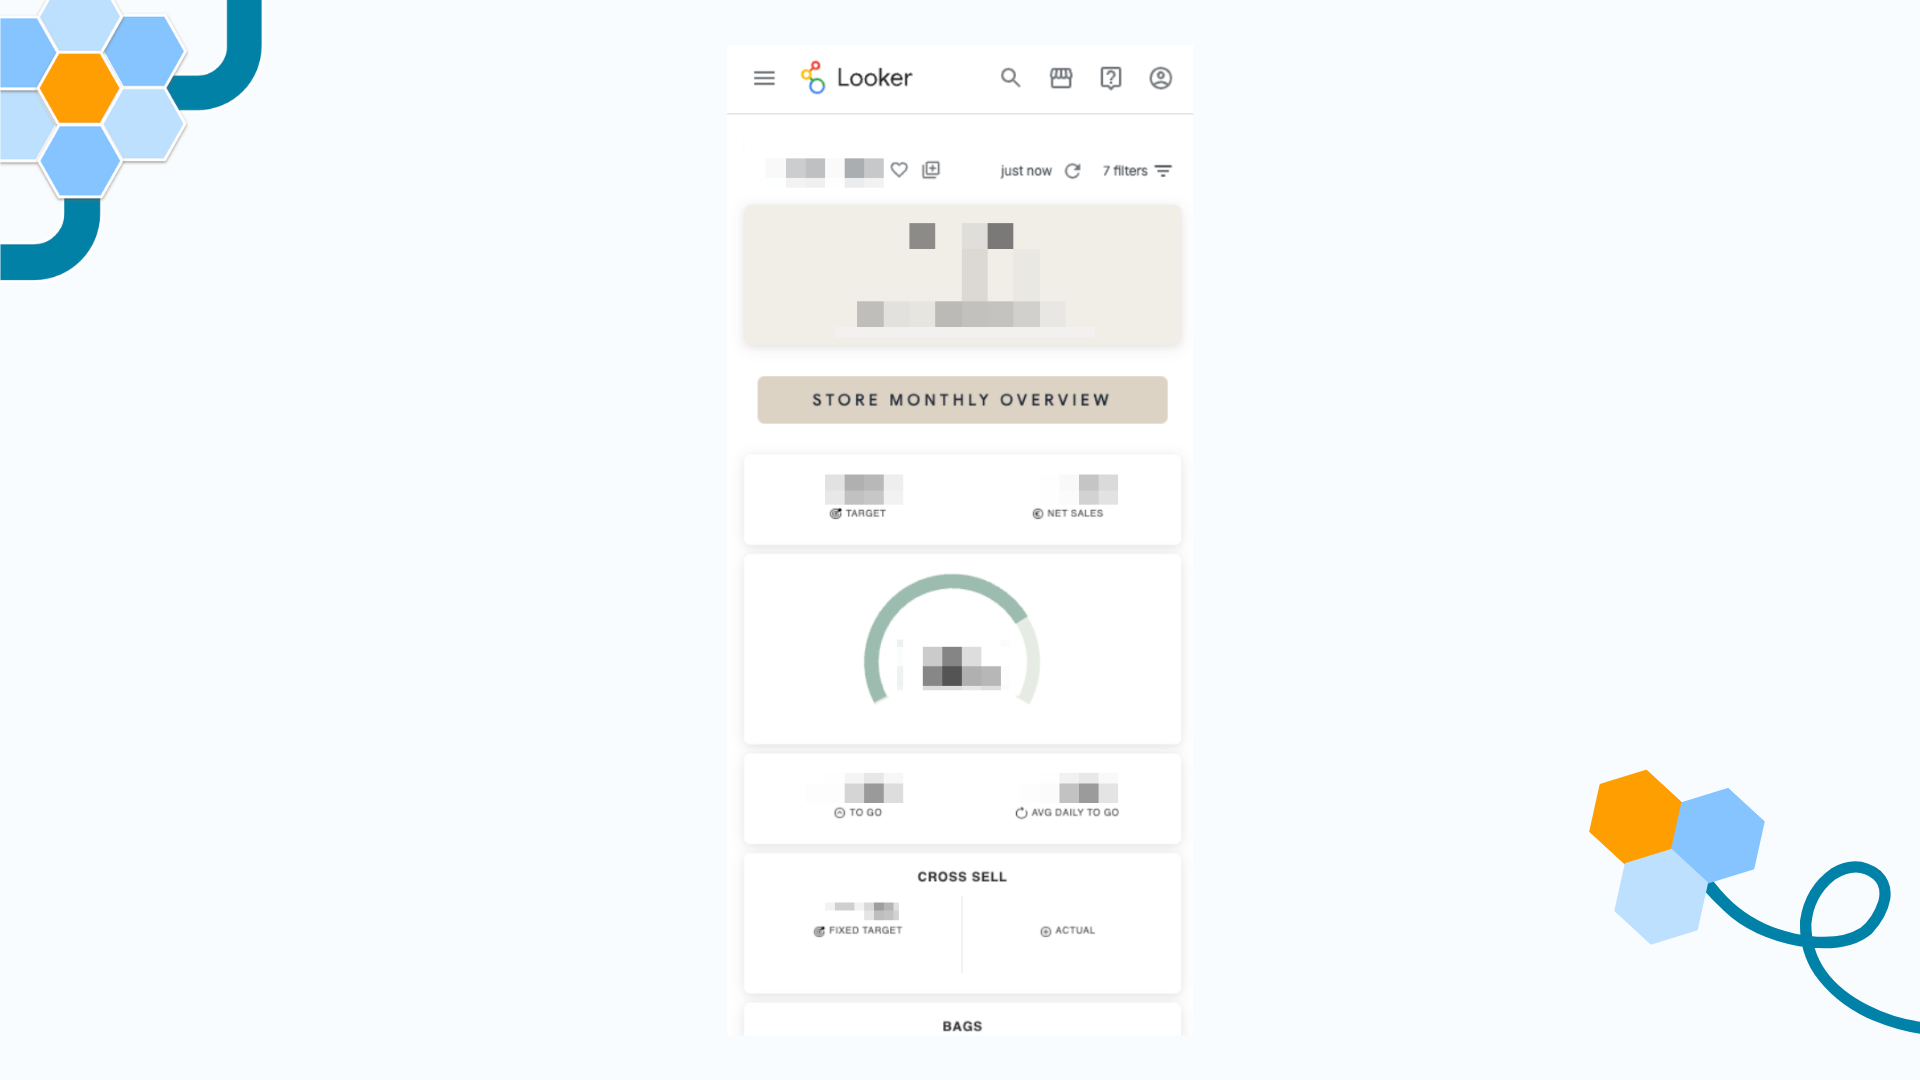
Setting up a Commercial Data Product function: Looker dashboards rolled out across more than 40 countries to steer retail, e-commerce, ops and wholesale — same metrics, same definitions, and no more arguing about the numbers in committee.
Three workstreams, decisions that actually move
Which KPIs should be in front of whom?
We build a KPI matrix shared across marketing, ops and finance, with definitions locked down. Dashboards are then designed around use, not around tools.
Where is your site losing conversions?
Funnel analysis quantifies the friction points and the revenue left on the table. We then prioritize tests by expected impact and implementation effort.
Which channel deserves more budget?
We reconcile the cross-platform view with the data available in your warehouse, then measure incrementality with means proportionate to your media volume.
The three major activations
Dashboarding & data viz
A KPI matrix with locked definitions, then dashboards designed around use: exec team, e-commerce, acquisition, ops. Built on the metrics layer so your teams can take them over.
CRO & analysis
Funnel analysis to identify friction points and the revenue left on the table. Tests are then prioritized by expected impact, run with a precise measurement methodology, and read statistically.
Media activation
Audience segmentation, attribution analysis and incrementality measurement: we reconcile the platform view with the warehouse view so decisions rest on shared numbers.
We adapt to your tools







.png)

What the teams we work with say
“I've worked with Smart Bees on several data and tracking projects and I can only recommend them. Beyond their technical expertise, they have a real ability to understand the business stakes behind the numbers and to propose concrete solutions. Smart Bees is a genuine asset for any company that wants to make better use of its data and steer its performance.”
“Since the start of the year, Smart Bees has helped us on our analytics and tracking projects. Their team is always available, and their responsiveness genuinely makes the difference. Thanks to their expertise, we move forward with far more confidence. A partner you can count on.”
Frequently asked questions
How do you measure incrementality without building a monster?
You don't need one. Below a certain media budget, geo tests and a clean read of the platforms are enough.
Who maintains the dashboards afterwards?
Your teams: they're built on the metrics layer and documented to be taken over.
Do you work with our media agency?
Yes. We bring the measurement and the arbitration; the agency keeps execution.
How long before you see an effect?
A first documented budget reallocation within six to eight weeks.

Thirty minutes, one founder, a straight answer.
We look at your setup on a screen share and tell you whether there's a real engagement here or not.
